Gerrymandering describes the practice of engineering the boundary of political districts in such a way as to give one party (almost invariably the one that draws the districts) an advantage in elections. This has often given rise to highly convoluted district boundaries—which just visually scream that some nefarious intent was afoot. The practice received its name when it was first used in 1812 by the Governor of Massachusetts, Elbridge Gerry, who created a district with a shape that was described to resemble a mythological salamander—and this gave rise to the portmanteau “gerrymander”.
Creatively contorted district boundaries are very eye catching, but this often deflects the attention from a deeper issue. Convoluted boundaries are merely a means to exploit a deeper underlying problem: that of manufactured discretization errors. To understand what that means, let us explore how we can “gerrymander” the political outcome of an election in either direction, and in both cases with highly benign looking district boundaries.
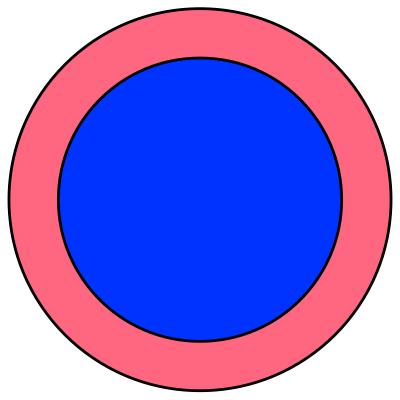
Picture the following situation: a pleasantly circular county with a city at its center and a suburban periphery. Let us assume, semi-realistically, that the city votes Democratic and suburbia votes Republican. Let us also assume that the county is split almost evenly but leans slightly Democratic: 55% of voters are Democrats and 45% are Republicans. Assuming, furthermore, a constant population density, this county would look as follows (in the canonical blue and red color scheme):

If the population density in the city were much higher, then the blue circle would look smaller—a very common distortion of electoral maps, which often show tiny blue spots in seas of red, which hides the often enormous urban population density behind these few blue spots, compared to a much lower rural population density. However, none of that will make any difference for the points we will now discuss; so we may as well stick with a visually correct map.
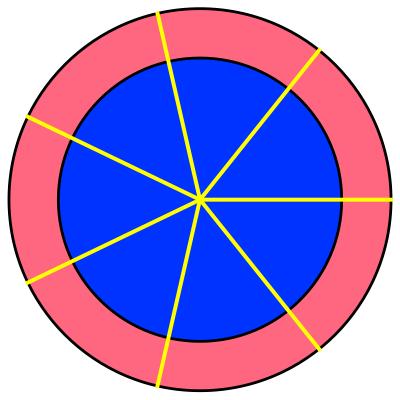
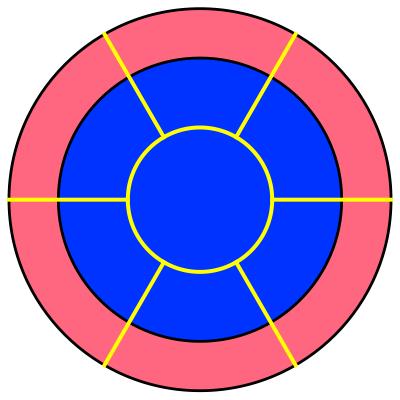
How do we divvy up this county? Say, we want to split it into 7 districts. Here are two highly plausible ways for doing so—let’s call them the “cake” and the “hub-and-spoke” motif:


None of these districts would strike us as gerrymandered. The first map looks like what we do when we split something as axially symmetric as this (like, well, a cake). The second follows the notion of “city” surrounded by “suburbs”. But what would these two ways of districting mean for the outcome of an election?
If we apply the usual “winner takes all” rule, then here’s what will happen: In the “cake” case, each slice has the same percentage of Democratic voters as the whole county: 55%. Hence, each slice goes to a Democrat, and the city council will consist of 7 Democratic representatives.
In the “hub-and-spokes” case it’s a bit more complicated. Surely, the city district is entirely in Democratic hands, so this goes to a Democrat. But what about the 6 suburbs? A simple calculation will help. Let us assume that $\alpha$ is the fraction of Democratic voters in each of the suburbs (which is evidently the same in each suburb). Since the overall fraction of democratic voters is 55%, or let us say, in general, we’ll write this as $\phi$, we know that with $N$ districts, and hence $N-1$ suburbs, the Democrats' fraction of votes must satisfy the following equation:
$$1 \times \frac{1}{N} + \alpha \times \frac{N-1}{N} = \phi \ ,$$
from which we get
$$\alpha = \frac{N\phi-1}{N-1} \ .$$
In the special case $N=7$ and $\phi=0.55$, which was illustrated in the figures above, we get $\alpha=19/40=47.5\%$. Hence the Democratic representatives lose in all suburbs, and so, overall, 1 Democratic and 6 Republican representatives get sent to the county council.
This is a huge difference! The same election outcome leads to, in one case, a completely Democratic city council and, in the other case, one that is almost entirely in the hands of the Republicans. Evidently, drawing those district borders is a matter of life and death for all those politicians, but this is something typically not directly in the hands of voters. Moreover, none of the two ways to divvy up the county exhibits the usual appalling look of a fiendishly gerrymandered district.
The hub-and-spoke case, despite looking geographically benign, appears more suspicious in its outcome, since a slight overall Democratic majority in the entire county is turned into a pretty resounding Republican majority in the county council. How did this happen? It happened by the basic trick of gerrymandering: create one district (here: the city) in which your political opponent wins a supermajority, such that in the other districts (here: the suburbs) your own candidates can just about scrape by with a victory. Essentially, the city needlessly “steals” Democratic votes from the suburbs in order to cement a victory for the Democratic candidate that was never in doubt, thereby making it impossible for the Democratic candidates in the suburbs to defeat their Republican challengers. Ironically, there will likely be many Democratic city voters who take great pride in resoundingly having defeated the Republican opponent of their Democratic candidate for the city district, not realizing that this is what permitted 6 Republican candidates to take all the suburbs.
Why is this bad? On the surface, because it upsets the fact that the overall county leans Democratic. More holistically speaking, because it disenfranchises a lot of Democratic voters. 55% of voters have to contend with only 14% of representatives in the county council. This appears to violate the notion of a representative democracy, and it will frustrate a lot of voters. But if this is the concern, then one must admit that the cake-districting has the same problem: sure, the county leans Democratic, but not 100:0, as the resulting composition of the county council would suggest! In each county a small majority suffices, thanks to “winner takes all”, to get a resounding supermajority in the county council. This time, 45% of all voters have been disenfranchised.
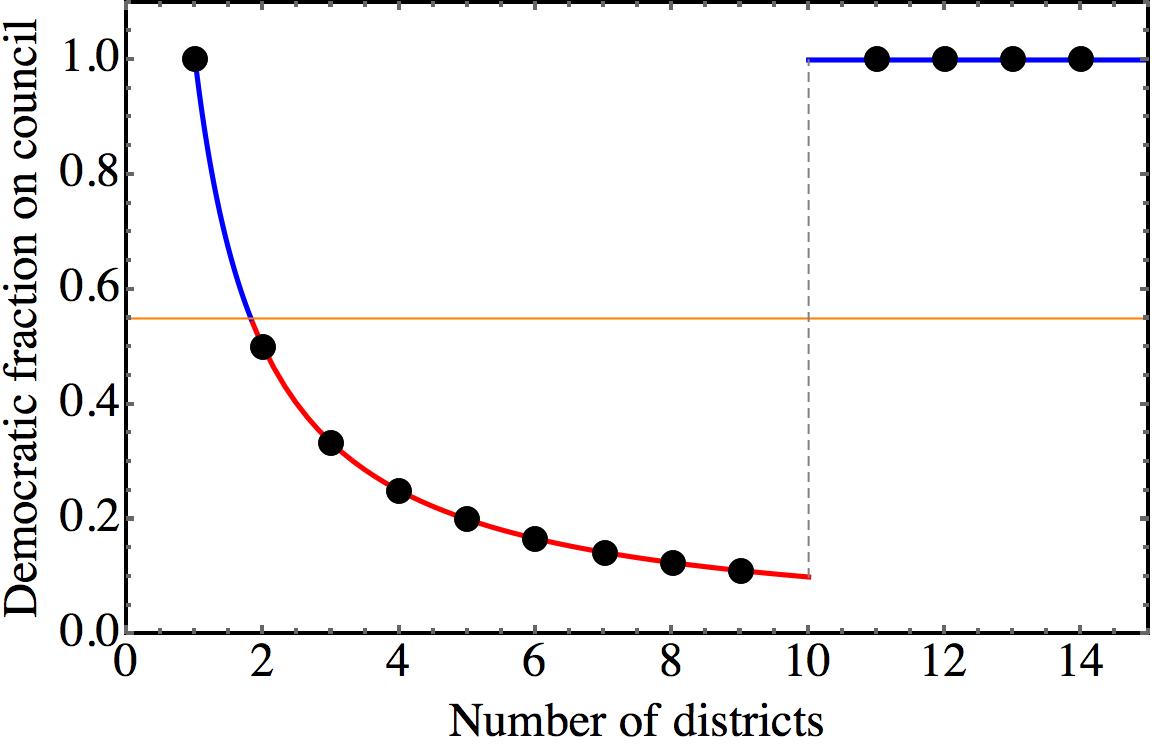
It is also instructive to see how under hub-and-spokes districting the fraction of democratic votes in the county council depends on the number of districts. The following graphics shows the fraction of Democratic representatives in the county council, plotted against the total number of districts:

Notice not only how strongly the outcome of one and the same election varies depending on the number of districts we draw. The outcome may also rapidly vary under seemingly minor changes. For 9 districts, Democrats comprise 11% of the members in the county council; for 11 districts they suddenly comprise 100%! Incidentally, what happens at 10 districts? Well, at that point the vote in each suburb splits exactly 50:50, and we would have to look into details.
Fun fact: the by far fairest number of districts is 2! One for the city, and one for the suburbs!
Overall, the vast shifts in political representation we can see here, and which have been brought about by nothing but different ways of drawing district borders, ultimately exploit the common “winner takes all” rule of American voting. Gerrymandering is simply one way to exploit the fact that if we can shift rational fractions around and at the right moment round to an integer, massive discretization artifacts can arise. This, of course, is well known in science and engineering, and a lot of work is dedicated to minimize discretization artifacts. Strangely, it seems that these very same artifacts are exploited with sheer endless creativity once they arise in politics.
Indeed, gerrymandering districts is just one of the many instances where this problem arises. The electoral college is another, especially if delegates are assigned by the “winner takes all” rule. The fact that each state gets two senators, irrespective of population, is a related one. Or the fact that the speaker of the house, or the senate majority leader, have outsized influence in what will be voted on, or what initiative the entire body will be able to undertake, despite maybe only holding a small majority in the chamber, is yet another one. Sometimes mechanisms are set in place to counterbalance the worst outcomes of such situations. For instance, requiring that certain important decision need more than a 50% majority forces compromise. Hence, the Republican's procedural change in April 2017 to affirm a nominee to the United States Supreme Court by simple majority counteracts such a mechanism, and hence gives more power to engineered discretization artifacts.
It would seem that this is an even bigger issue to come to grips with than the narrower case of gerrymandering, which however has the merit of coming with a visually pleasing battlecry: "Just look at the shape of that district!" Representative democracy has curious mathematical challenges, of which discretization errors are just one type. You might want to read up on May's theorem and especially Arrow's theorem—for instance in this blog post by Alex Bolton. Maybe one day we get to debate this in good faith.

Markus Deserno is a professor in the Department of Physics at Carnegie Mellon University. His field of study is theoretical and computational biophysics, with a focus on lipid membranes.

0 Comments