The arrival of several highly effective vaccines has dramatically changed the landscape of the Covid-19 pandemic. Remarkably, though, a considerable fraction of people are hesitant to get immunized—for reasons that would be fitting material for a different blog post, but which right now I will sidestep. What interests me here, instead, is how this hesitancy affects the ongoing pandemic—especially in the light of common statements we hear very often in this context. For instance, Dr. Rochelle Walensky, director of the CDC, has warned that Covid-19 is becoming a “pandemic of the unvaccinated.” Conversely, Emily Miller, who briefly served as the FDA’s assistant commissioner for media affairs, claimed that “[one’s personal] decision not to get vaccinated does not affect anyone else’s health.” I will try to explain why I consider the first statement misleading and the second one flat-out wrong.
But I don’t just want to argue by waving my hands. Being a physicist, I’m itching to do a little bit of mathematical modeling, since this helps me to understand the world better. However, I want to preface everything that follows by emphasizing that I am not an epidemiologist. You have every right to be skeptical of what I am about to write and instead consult a real epidemiologist. That being said, the type of modeling I plan to roll out is actually pretty standard. It’s also very simple—which makes it easy to understand what’s actually being modeled, but which also means that quite a lot of finer points are being passed over in the first round. This often makes people nervous (“How can you ignore all that???”), but physicists like playing around with simple models. The justification for this is that if one understands the simple cases (and their limitations!) reasonably well, one has a good basis for thinking about what all the real world complications actually do, and when they matter. In the same spirit, i’s apt to remember the great aphorism generally attributed to British statistician George Box: “All models are wrong, but some are useful.”
My proposed model is a minor extension of the good old SIR model—to which you can get an excellent introduction in the YouTube video of Oxford mathematician Tom Crawford or in this somewhat more technical article on Wikipedia. In the name “SIR” the letters “S”, “I”, and “R” stand for individuals Susceptible for catching a disease, those Infected with it, and those that have Recovered (and are then assumed to no longer being able to catch it). The basic idea is that susceptible people have some probability of catching the disease when they encounter infected people, and that infected people recover after some typical time. That’s basically it. For this scenario, one can write a set of three differential equations that describe the time evolution of these three groups of people, and they look like this:
$$\begin{align}
\dot{S} &= -b\frac{S I}{N} \\
\dot{I} &= +b\frac{S I}{N} \,-\, kI \\
\dot{R} &= +kI \ .
\end{align}$$
Here, the dot over the letters means “rate of change,” the parameter “$b$” is the rate at which susceptible people catch the disease from infected ones, and the parameter “$k$” is the rate with which infected people recover. The variable “$N$” describes the total number of people, and one can easily show, by adding all equations, that $N=S+I+R$ is constant (because $\dot{N}=\dot{S}+\dot{I}+\dot{R}=0$). The ratio $R_0=b/k$ plays a very important role in the spread of the pandemic: if it is bigger than 1, then in an initially healthy population the disease will spread (initially) exponentially, until so many people have been infected, and others have recovered, that the virus cannot find new “victims,” and then the epidemic peters out. Observe that this model entirely avoids thinking about where people live (dense city? rural countryside?), how they actually meet one another (the “social networks of interactions”), the potentially outsized importance of rare events (“superspreaders”), and many other complications. All of this is ignored—for better or worse.
I will now modify this model in a very simple way by subdividing all three populations into two classes: vaccinated and unvaccinated ones, which I will label with a subscript “${\rm v}$” and “${\rm u}$”, respectively. The important point is that the rates of catching the disease from someone who is sick—the $b$ values—depend on whether that person is vaccinated, since in that case they will catch the disease less readily. To keep things simple, I will assume that it doesn’t matter whether you catch it from a sick vaccinated or a sick unvaccinated individual: once someone is sick, I take them to be equally contagious. (I’m being quite uncharitable to the vaccine here!) Also, I will assume that the recovery time is the same with or without vaccine (again, I’m being very pessimistic).
With these assumptions, an extended set of equations now looks as follows:
$$\begin{align}
\dot{S}_{\rm v} &= -b_{\rm v}\frac{S_{\rm v}}{N}(I_{\rm v}+I_{\rm u}) \\
\dot{S}_{\rm u} &= -b_{\rm u}\frac{S_{\rm u}}{N}(I_{\rm v}+I_{\rm u}) \\
\dot{I}_{\rm v} &= +b_{\rm v}\frac{S_{\rm v}}{N}(I_{\rm v}+I_{\rm u}) \,-\, k I_{\rm v} \\
\dot{I}_{\rm u} &= +b_{\rm u}\frac{S_{\rm u}}{N}(I_{\rm v}+I_{\rm u}) \,-\, k I_{\rm u} \\
\dot{R}_{\rm v} &= +k I_{\rm v} \\
\dot{R}_{\rm u} &= +k I_{\rm u} \ .
\end{align}$$
Observe that it is the sum of vaccinated and unvaccinated infected individuals, $I_{\rm v}+I_{\rm u}$, which turns susceptible people into infected ones (albeit at different rates). This implies that unvaccinated infected individuals affect vaccinated susceptible ones (and vice versa, but that’s typically less frequent). For this reason the pandemic isn’t just happening among the unvaccinated. It spreads between the two classes. (Physicists would say they are “coupled”.) More specifically, we will see that the majority of vaccinated people who get sick do so because of unvaccinated sick individuals.
In order to make quantitative predictions, we now need to put in some numbers. I will consider the case of the United States, where $N\approx 330$ million people, of which a fraction $f$ is fully vaccinated. Currently, that fraction is pretty close to 50%. I will also assume that the recovery rate is $k=0.07$, which leads to $1/k\approx 14$, meaning, that it takes about 2 weeks to get over Covid. Evidently, there’s a distribution, and there’s the very significant complication of “long Covid”, which I ignore (and which does not affect the dynamics of the epidemic). The more difficult thing to estimate is $b$, since this amounts to saying how contagious the disease is. I will use $b_{\rm u}=0.15$, which corresponds to $R_0=b_{\rm u}/k\approx 2.1$ for the unvaccinated. This is close to what we thought to be the infectivity of the original Covid-19 strain, but the Delta variant is believed to be about twice as infective. On the other hand, this simple model doesn’t account for masks, for quarantining, and for the fact that (most) sick people will likely try to minimize exposure to others for much of the time they are likely infectious. I’m accounting for all of this by assuming a smaller $R_0$ value, but this is a bit ad hoc. My expectation is that I’m likely underestimating Delta’s ability to spread.
What about the getting-sick-rate for vaccinated people? Taking an average vaccine efficacy of 90%, I will assume that the rate $b_{\rm v}$ is ten times smaller than that for the unvaccinated, or $b_{\rm v}=0.015$. Notice that the corresponding $R_0$ value is then about 0.21, well below 1, showing that if only everyone was vaccinated, the pandemic would quickly wane.
I finally need some numbers for sick people. Taking the current daily case rates, it seems reasonable that at present (i.e., August 10, 2021) about 1 million people are infected, of which maybe 90% are unvaccinated. This means I will assume that right now, “at $t=0$”, we have $I_{\rm v}(0)=100,000$ and $I_{\rm u}(0)=900,000$ (these details actually do not matter a lot for our conclusions). This gives us all we need to predict how the pandemic evolves—at least within the model we just wrote down. All we need to do is (numerically) solve the coupled differential equations.
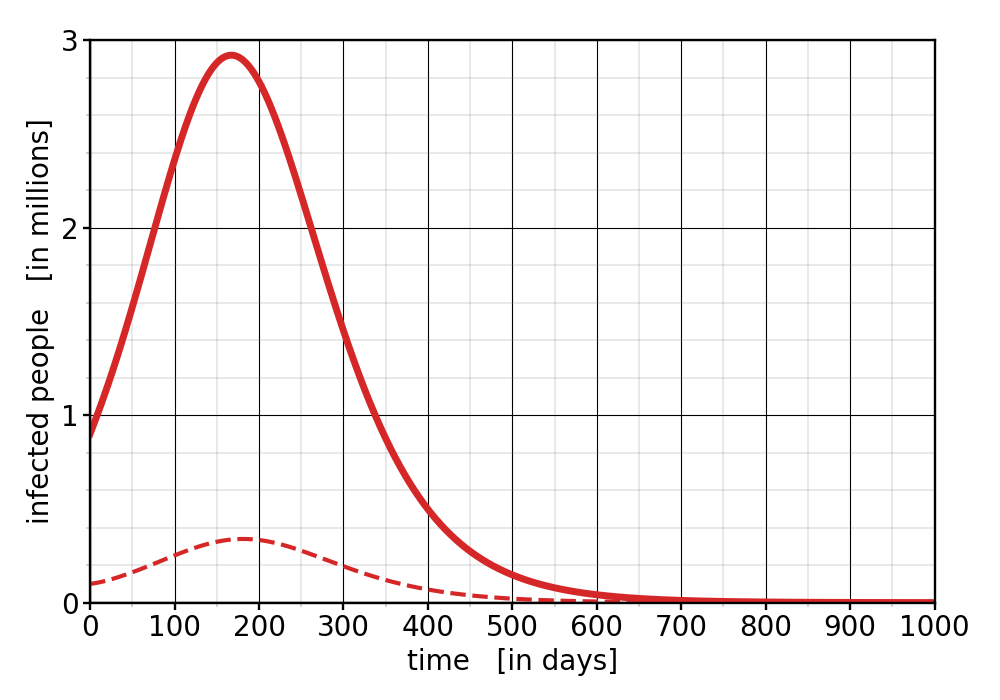
Let us start with the situation as it is right now. We have a vaccination rate of 50%, and let’s assume it stays there. (My hope is to convince people to get vaccinated, so I want to first show what happens when no one changes their mind; I’ll then discuss what happens at higher overall vaccination rates.) How will cases evolve? The following graph plots the number of infected people as a function of time. The solid curve represents the unvaccinated people, the dashed curve the vaccinated ones:
Figure 1: Infected people as a function of time, assuming a vaccination rate of $f=50\%$.
At a casual glance, this doesn’t look too bad—the cases don’t really grow exponentially, they will ultimately become only about three times as high as they are now, and they will then drop down again. The vaccinated case numbers also grow, by a bit more than a factor of 3.
But notice that the wave, which builds into winter and then wanes in the next Spring, evolves really slowly. It takes almost a year until case numbers have come to the same values we have now! We’ll have at least a year more of the pandemic with us, and about 2 years until it’s mostly over! I don’t think any of us can currently stomach this outlook. Observe also that the very existence of a (small) peak in the vaccinated population is a sure sign that they are being made sick by the unvaccinated ones. (Indeed, the unvaccinated peak preceeds the vaccinated one by about 2 weeks: the former seems to “drive” the latter.) This is understandable, because the $R_0$ value among the vaccinated is much smaller than 1, and if that would be what drives the disease spread among the vaccinated, then their case numbers should quickly decline, not actually grow.
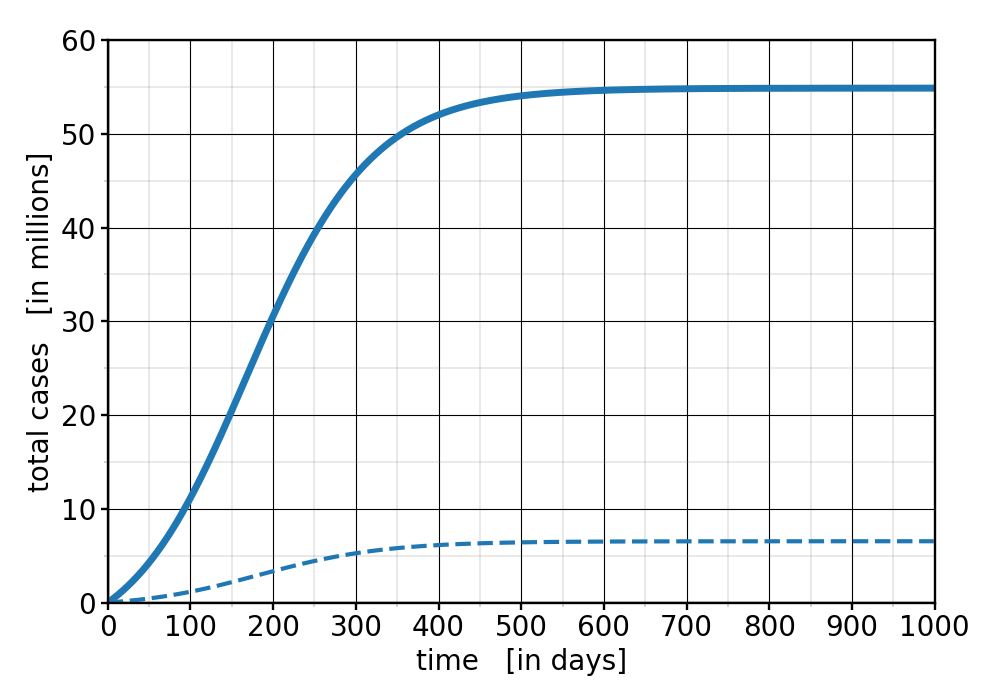
Besides current cases, we also want to know what happens to the total case numbers. How many unvaccinated people will ultimately get sick? And how many vaccinated ones? Here’s the answer in this second graph:
Figure 2: Total (=cumulative) case numbers, assuming a vaccination rate of $f=50\%$.
We see that ultimately about 55 million unvaccinated people are predicted to catch the virus, plus an additional 6.5 million vaccinated ones. Those are very sizable numbers! So far, throughout the entire pandemic, about 36 million cases were counted in the US. We may hope it doesn’t get this bad, but it seems unlikely that political leaders are willing to enact lockdowns and strict mask mandates again, which might rob us of emergency measures to combat this wave. Moreover, recall that I have been rather conservative with the $R_0$ value of the virus. This is a real threat.
The number of cases among vaccinated people looks maybe unexpectedly large. We started with 10 times fewer sick vaccinated people, and it mostly stayed at this ratio. Why did that proportion not drop? Does the vaccine not work? Well, it does—10% was, after all, its “failure rate.” But more importantly, the key is that the tremendous growth of infected unvaccinated people puts the vaccinated ones at risk as well. Remember that it’s the sum $I_{\rm v}+I_{\rm u}$ which drives overall new infections, and since among those two terms $I_{\rm u}$ is clearly the bigger one, we conclude that the great majority of vaccinated people who get sick do so because they get infected by unvaccinated people. In that sense, it is clearly not just a personal choice whether someone gets vaccinated or not. Letting the virus burn so uninhibitedly through the population also puts those at risk who took the precautions. Less so, but still.
In fact, we could look at a (very hypothetical) scenario where the two populations truly “decouple”: vaccinated people only encounter other vaccinated people, unvaccinated people only encounter other unvaccinated ones. This turns the epidemic truly into two “non-interacting” classes of people. With the values for $b$, $k$, etc. we used so far, we would then find that the number of vaccinated infected people very rapidly declines. By the time they reach their maximum of $I_{\rm v}\approx 340,000$ in the actual “mixed” epidemic, they have dropped to 5 (!) in the decoupled one (and we’d have 50 times fewer cases in total). Conversely, the unvaccinated reach a staggering maximum of 30 million simultaneous infections after just 2 months, and ultimately a total of 140 million cases—almost the entire unvaccinated population. Clearly, the presence of vaccinated people massively protects the unvaccinated already now.
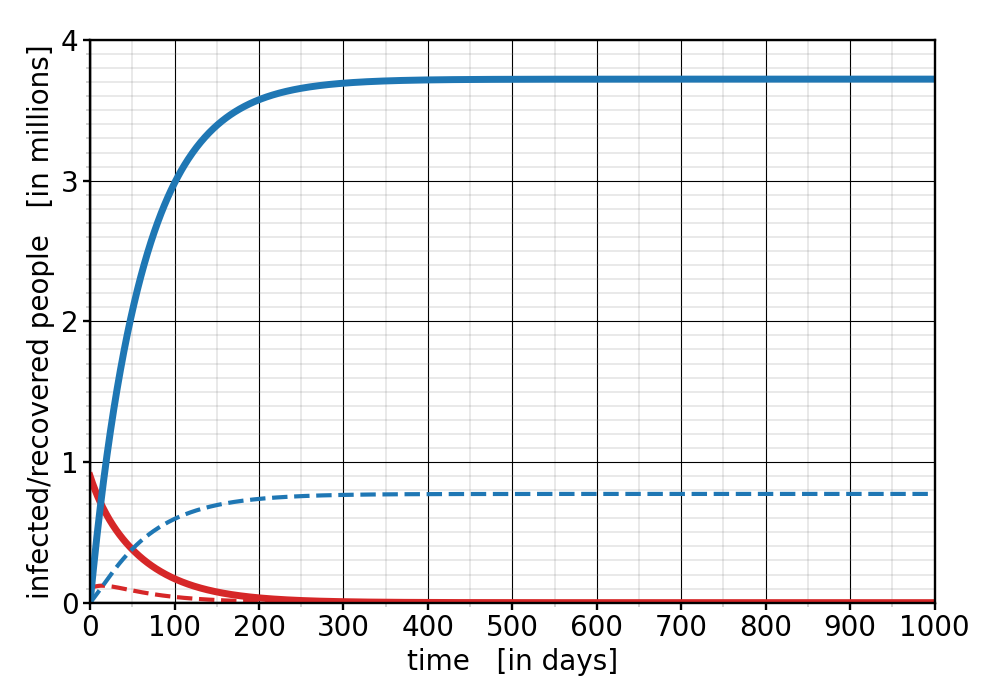
Let us now dream a bit! What would instead happen if we had higher vaccination rates—something entirely within our grasp, since the vaccines are abundantly available. Consider therefore a vaccination rate of 70%. In this case, the pandemic plays out very differently. Here’s a plot showing simultaneously the total infections (red) and the accumulated number of cases (blue). Again, solid curves are the unvaccinated people, while dashed curves are the vaccinated ones:
Figure 3: Number of infected people (red) and total case count (blue) for a vaccination rate of $f=70\%$. The solid curves are the unvaccinated individuals, the dashed curves are the vaccinated ones.
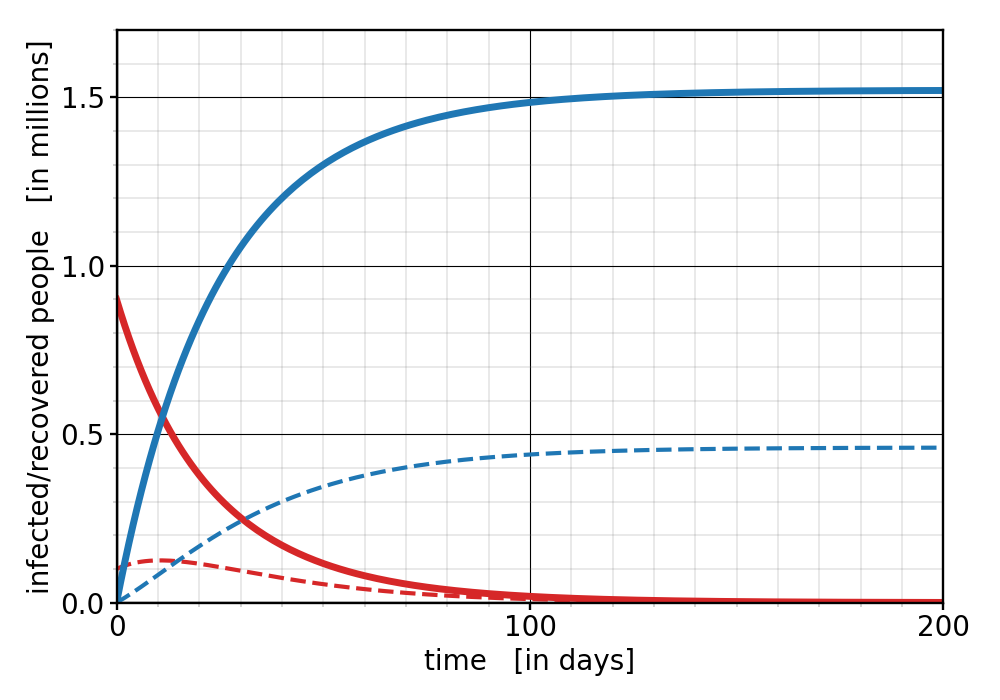
Three drastic changes are noticeable: First, the number of infected people at any give time goes down right from the start. No new wave! Second, the total number of cases is drastically cut down: instead of getting about 55 million unvaccinated new cases, we only get about 3.7 million—almost 15 times less! And third, the pandemic seems to be over significantly faster: after less than a year the infections have dropped down to very small numbers. We can put the pandemic behind us much earlier! In fact, if we dream even more optimistically, about a vaccination rate of 85%, then things look as follows:
Figure 4: Number of infected people (red) and total case count (blue) for a vaccination rate of $f=85\%$. The solid curves are the unvaccinated individuals, the dashed curves are the vaccinated ones.
Notice the even shorter time scale (I’m using a horizontal axes that is 5 times shorter!) , and the further reduction in overall cases, even though the latter is not as dramatic as the step from 50% to 70%.
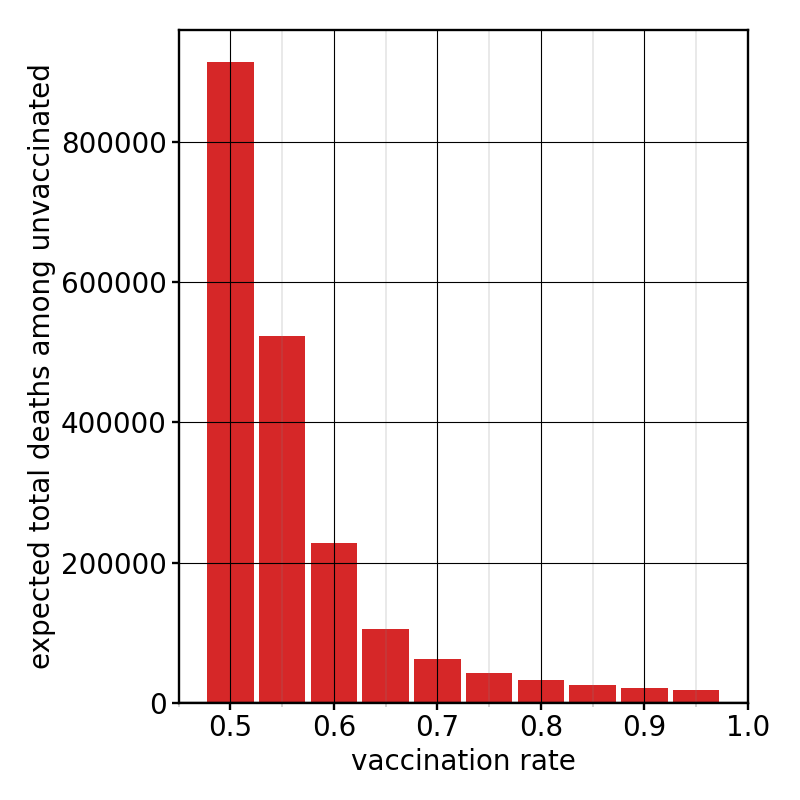
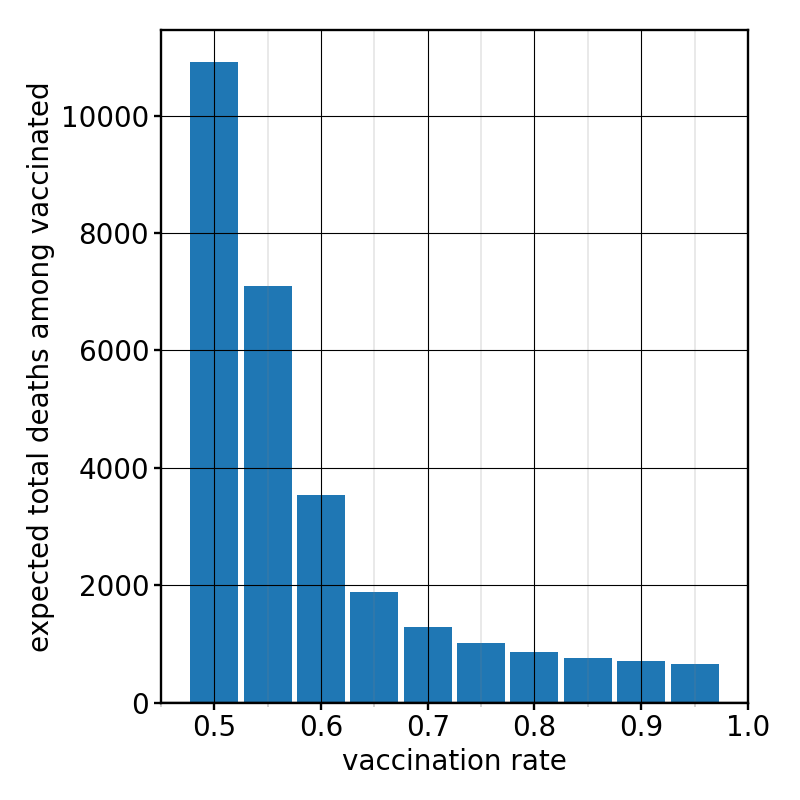
Another thing we should talk about is the number of fatal cases. People who recover from the disease no longer infect others. But that would of course also happen if they don’t recover but if they instead die. Our model is quite agnostic about this, and some people indeed translate the “R” in the SIR model into the more general term “removed.” For the pandemic modeling it doesn’t matter what happens with these people, but of course friends and family care a lot. To estimate the casualties, we must know how many cases will be fatal. Last year’s data in both the US and the UK indicated that, as a simple rule of thumb, about 1 in 60 people who received a positive Covid test died from the disease (about 3 weeks later). Hence, dividing the cases by 60 gives the expected fatalities—very roughly. (How Covid hits different age groups differently clearly is something worth incorporating in a refined calculation.) Even though this 1-in-60 rule was observed for the original strain of the virus (for a population that was unvaccinated), I will in the following assume that it remains true for the Delta variant and the currently unvaccinated people. (This variant is often described as more deadly, but we have also figured out better ways for how to treat Covid-19, and average patients are now younger.) However, for vaccinated people we need a further correction: the protections from the vaccine against severe Covid and death are substantially better than the efficacy of 90%—maybe 99%. I will therefore assume that the fatality ratio gets reduced by an additional factor of 10. With this in mind, we can then project the expected number of deaths from the number of recovered people, both in the vaccinated and the unvaccinated group, even resolved by nationwide vaccination rate. Here are these (very tentative!) numbers—displayed in different plots between the unvaccinated and vaccinated people, because they are so different:
Figure 5: Expected total deaths among the unvaccinated, as a function of vaccination rate $f$
Figure 6: Expected total deaths among the vaccinated, as a function of vaccination rate $f$
Observe the difference in the vertical scales! the bars for the vaccinated are approximately a factor of 80 smaller! Currently, at a vaccination rate of $f=50\%$, we’re heading for about 900,000 more deaths among the unvaccinated! This is more than the number of people who so far have died from Covid-19 in the US, which is about 600,000. This sounds huge and suspicious. But recall also that I have made actually quite gentle assumptions about the virus. If we let a virus as deadly and contagious as the Delta variant of SARS-CoV-2 burn through an unvaccinated population, we will see many deaths.
But notice that most of these deaths are entirely preventable! Pushing the vaccination rate higher than 50% will have immediate and quite massive positive effects. At 70% the deaths among the unvaccinated have dropped almost 15-fold, to about 62,000. And while this is still a sad number, it is not nearly as terrifying as 900,000. After all, we saved about 800,000 lives! It really pays to push vaccinations up, and the biggest effect will be seen in the avoidance of deaths among the unvaccinated. But notice that deaths also decay in the vaccinated group, even though this group becomes bigger as we increase $f$ and hence contains more potential victims of the disease. The reason is again absolutely clear: the overwhelming number of infections (and hence deaths) in the vaccinated group is caused by unvaccinated sick individuals, and cutting their number drastically down also makes the vaccinated people safer.
Let us also briefly consider how much longer we have to live with this pandemic—at least according to our very simple model. As a measure for “pandemic end” we can for instance (somewhat arbitrarily) say that the pandemic is “over” when the total number of infections has dropped to 0.01% of the total population in the US. The precise answer will depend a bit on what we choose here, but not actually all that much, since towards the rear end of the pandemic cases will decay exponentially, and then it doesn’t much matter when exactly we declare the number is small enough.
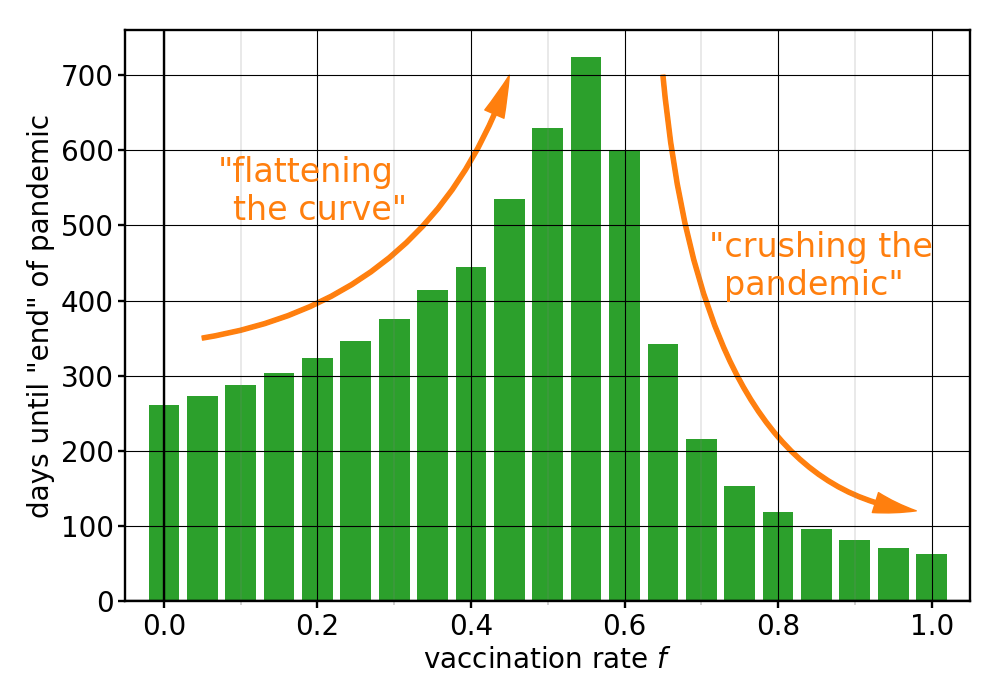
Using this convention—here is our model’s prediction how much longer the pandemic will be with us, as a function again of vaccination rate (taken actually all the way from $f=0\%$ to $f=100\%$):
Figure 7: Estimated time until the pandemic has basically petered out (meaning $I_{\rm u}+I_{\rm v}<N/10,000$), as a function of vaccination rate $f$.
There’s a lot to unpack here. At the current vaccination rate of 50%, the pandemic will be with us for about 2 more years. But increasing vaccinations helps a lot. We could be done with this by Christmas if we all pull together and get the jab! Furthermore, notice that this graph has a maximum at around $f=55\%$. Why? The answer is that at very low vaccination rates we don’t really contain the pandemic, but we can stretch it out in time and thereby lower both current and cumulative case numbers. That’s what’s come to be known as “flattening the curve.” But beyond a critical vaccination rate we don’t just flatten the curve. We crush the pandemic, because the growth rate is no longer positive. The $R_0$ value averaged over the entire population drops below 1, and then we’re actually reversing growth. This is visible both in the number of cases, but also in the expected duration of the pandemic. It is therefore infuriating how close we seem to be right now to crushing it, but vaccination numbers are stalling just as we’re getting there.
As a last question, let us investigate what happens when we diligently ramp up vaccinations, but then an even nastier variant comes along that reduces how well the vaccine works. Right now, I assumed that $b_{\rm v}=b_{\rm u}\times(1-\phi)$, where $\phi$ is the efficacy of the vaccine. Our chosen value $\phi=90\%$ then implies an infection rate among the vaccinated that is 10 times lower than among the unvaccinated. But when the efficacy drops, the infection rate among the vaccinated increases. What would this do to the pandemic?
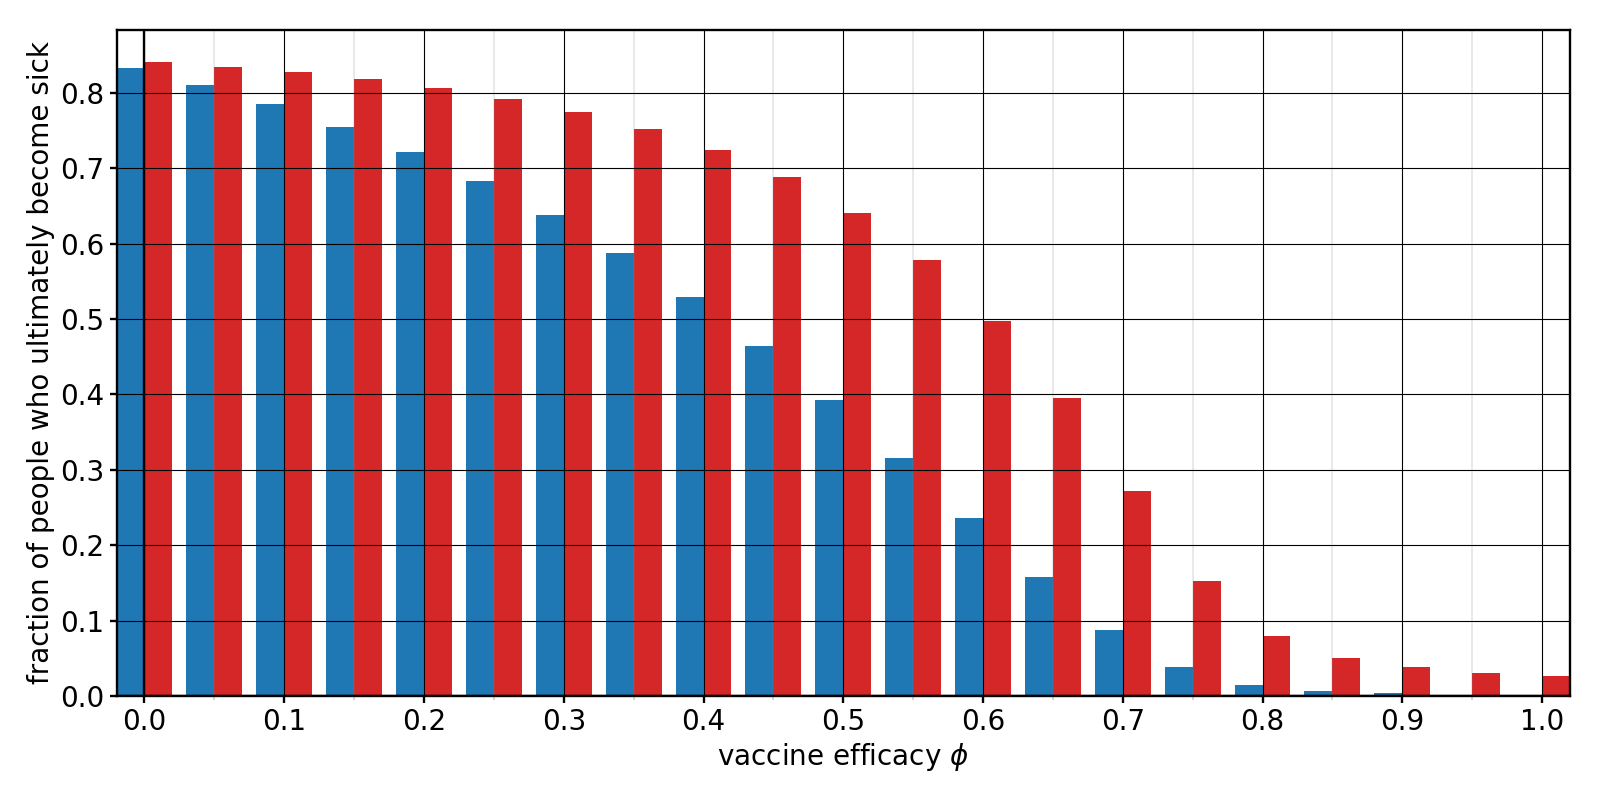
Let us consider a situation where we have actually managed to reach an $f=70\%$ vaccination rate, but then the vaccine’s efficacy drops. The following bar chart shows what fraction of the vaccinated (blue) and unvaccinated (red) population would ultimately catch the disease, as a function of efficacy $\phi$.
Figure 8: Fraction of vaccinated (blue) and unvaccinated (red) people that would ultimately catch the virus if the vaccine efficacy has the value $\phi$, assuming an $f=70\%$ vaccination rate.
We see that, unsurprisingly, a lower efficacy leads to a larger fraction of sick people—among both the vaccinated and the unvaccinated. The unvaccinated are of course still more likely to catch the virus, but what’s surprising is that the effect on them seems to be even more dramatic. Observe that there seems to exist a “critical” efficacy, $\phi_{\rm c}$, somewhere around 75%, below which there is a more pronounced uptick in cases. What sets this value? The critical point where the pandemic changes between growing and shrinking is where $\dot{I}_{\rm v}(0)+\dot{I}_{\rm u}(0)=0$. This is equivalent to the condition that the population-averaged $R_0$ value becomes 1:
$$\begin{equation}\frac{b_{\rm u}(1-\phi)f + b_{\rm u}(1-f)}{k} = 1 \ , \end{equation}$$
which can be solved for the critical efficacy. Remembering that $R_0=b_{\rm u}/k$, we get
$$\begin{equation}\phi_{\rm c} = \frac{1}{f}\Big(1-\frac{1}{R_0}\Big) \ . \end{equation}$$
For our numbers this gives $\phi_{\rm c}\approx 76\%$, quite close to the point below which the red and blue bars pick up more rapidly.
These considerations show that at a higher overall vaccination rate the vaccine’s efficacy does not need to be so high in order to keep a large outbreak at bay. But there are limits! Even at 100% vaccination rate $\phi_{\rm c}=1-1/R_0$, which in our case is about 53%. This shows why we are so lucky that the Covid-19 vaccines are so good. The efficacy of the typical flu vaccines many of us get each year is lamentably low: between 40% and 60%. At that rate, we could not hold Covid-19 at bay! (That is because Covid-19 is more infectious than the typical seasonal flu, which has an $R_0$ value around 1.3. This much lower value gives a critical efficacy $\phi_{\rm c}\approx 23\%$, so that a 50% effective vaccine is actually sufficient.)
Conversely, if the vaccination rate drops below the (same!) critical value $1-1/R_0$, then $\phi_{\rm c}=1$, and we are always in the regime where an epidemic outbreak cannot be avoided, even with perfect vaccines. Notice that this is exactly where we seem to be right now! Even with a 90% effective vaccine, we cannot prevent a wave if only half the population took it—just as we have found above! This is what all the discussions about vaccine-induced herd immunity are about, and why it is so important to push the vaccination rate up. At 70%, as we have just calculated, $\phi_{\rm c}\approx 76\%$, and since the actual efficacy of the vaccine is better than that (as best as we know), we can avoid (sadly: could have avoided) a wave. Recall, however, that this threshold is dependent on the $R_0$ value of the virus—for which I made assumptions on which reasonable people may well disagree. In any case, more infectious variants will push the threshold up and will make it increasingly hard to fight Covid-19. Notice also that this threshold is no all-or-nothing transition but a “rounded crossover,” which is one of many reasons why it is so hard to give a clear answer to the question where exactly herd immunity lies.
(Incidentally: this reasoning also explains the maximum in the pandemic-duration plot from above (Figure 7): at $R_0=0.15/0.07\approx 2.14$ and $\phi=90\%$, the critical vaccination rate above which we begin to crush the pandemic is $f_{\rm c}=(1-1/R_0)/\phi\approx 59\%$, which is very close to the observed peak.)
This is probably more than enough technical stuff for a single blog post. Let me leave you with two more general thoughts.
First, I want to emphasize the obvious fact that not all unvaccinated people choose to stay unvaccinated. Kids under the age of 12 cannot yet get the vaccine! Since in the US this group is about 50 million people strong, or about 15% of the total population, we cannot get to a vaccination rate higher than 85% without, say, an emergency use authorization for younger children. I suspect this will likely come at some point in the (hopefully not too distant) future, but even before then, there is a substantial gap between the current 50% and the already achievable 85%. As I have tried to argue with this very simple model, there is a huge difference in cases, deaths, and the overall length of the pandemic between our current state and what is possible if we all just work together. It would be great if more of us would understand this, if we could all see ourselves as being part of a big connected community in which our actions define our joint future.
Second, nothing I said should distract from the fact that the pandemic is only truly over when it is over worldwide. New variants can always upend everything—and they will if we just keep letting the virus burn. My point was to show how much better we can do here, and how much vaccine hesitancy, often defended in the name of personal freedom and liberty, will contribute to massive needless suffering.
I hope that the illustrations I have tried to offer with the modified SIR model, even though simplified and idealized, help to get this key point across, which I believe to be quite robust against many of the complications one could undoubtedly add.

Markus Deserno is a professor in the Department of Physics at Carnegie Mellon University. His field of study is theoretical and computational biophysics, with a focus on lipid membranes.

0 Comments